Greater Sudbury market history
A year-by-year technical record of House listings, closed sales, median prices, seasonal patterns and market balance across the City of Greater Sudbury. The narrative explains each major transition; the charts and complete tables preserve the evidence behind it.
- Cohort
- City of Greater Sudbury · BuildingType=House
- Activity history
- Partial Sept. 2015; complete Oct. 2015–Aug. 2026
- Annual price history
- 2021–2025; 2026 through Aug. 19
- Last reviewed
- September 3, 2026
Executive synthesis
September 2015 is partial; October 2015 through August 2026 are complete activity months. See the complete monthly activity table for exact values.
The long activity record shows several distinct phases.
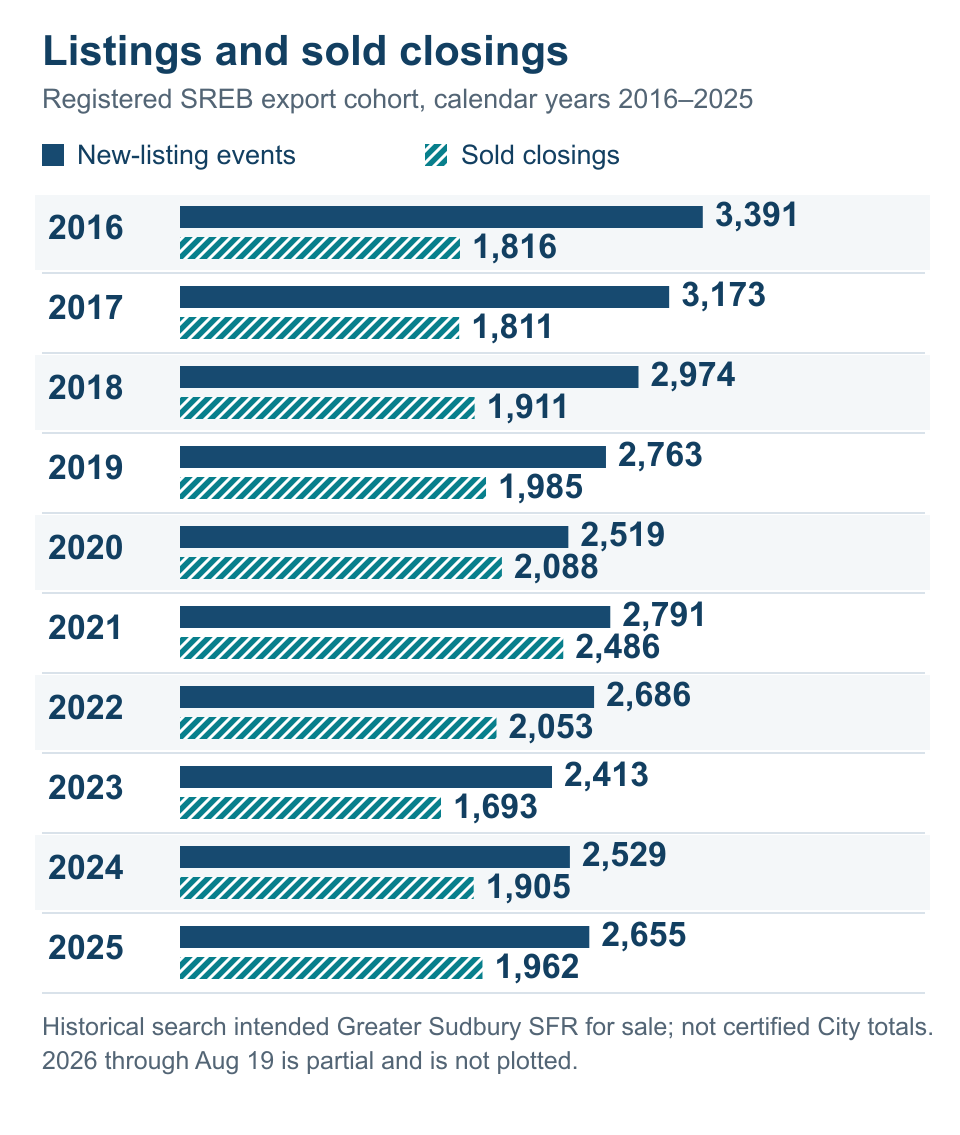
From 2016 through 2019, annual new-listing events declined each year while sold-close events were broadly stable and then rose. The annual flow sales-to-new-listings ratio moved from 54.97% in 2016 to 73.42% in 2019. That is evidence of tightening in the relationship between those two flows. It is not an inventory calculation and it does not tell us whether any particular listing sold.
The relationship tightened further in 2020 and 2021. Conditional sold-close events reached 2,351 in 2021, while the authoritative retained layer records 2,353 House sold closings. The conditional annual flow ratio reached 90.35%. May 2021 recorded the highest complete-month sold-close count in this series at 276. These figures show an unusually narrow gap between annual new-listing and sold-closing flows, together with the series-high monthly sold-close count. They do not, by themselves, prove why it occurred.
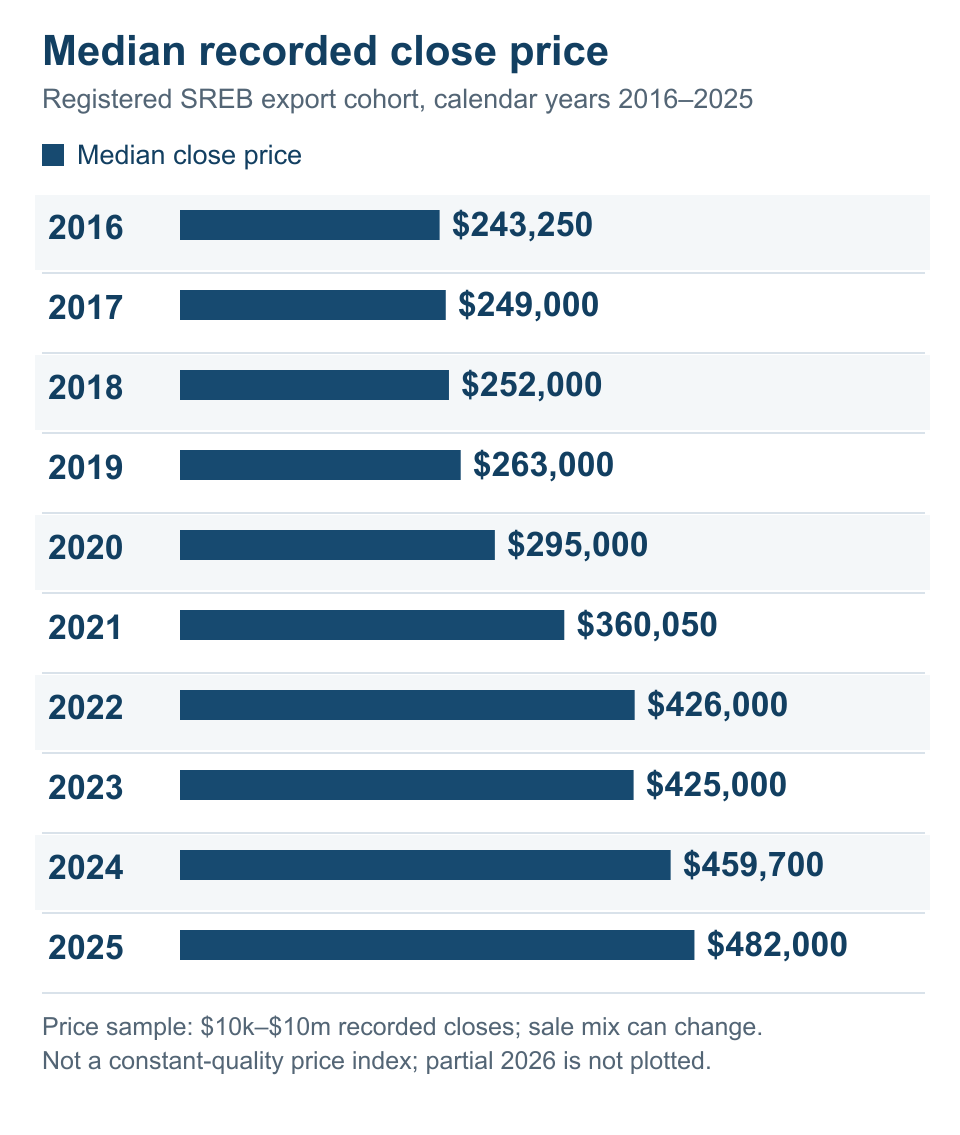
The activity cycle changed in 2022 and 2023. Authoritative sold closings fell 18.10% in 2022 and another 17.85% in 2023. Yet the annual median House close price rose 18.08% in 2022 and 0.90% in 2023. The combination matters: transaction volume and the middle closing price can move differently, which is one reason a single headline cannot describe the whole market.
Activity recovered in 2024 and 2025. Authoritative House sold closings rose 13.90% in 2024 and 3.99% in 2025. The annual median close price rose to $466,789 in 2024 and $485,404 in 2025. The 2025 median was 32.99% above the 2021 annual median, but that is a comparison of annual cohorts—not same-home appreciation.
The 2026 record is partial. Activity through August 31 totals 1,736 new-listing events and 1,189 sold-close events in the conditional event series. The retained authoritative layer records 1,122 House sold closings and a $500,000 median close price through August 19. March through July has deeper price and recorded-list detail, but those five months should not be projected into a full-year forecast.
The practical lesson is to separate four questions: How much property came to market? How much activity reached closing? Where was the middle closing price? How did completed transactions compare with the recorded list-price field? Each measure adds context. None sets the value of an individual home or guarantees the result of a launch.
What the data includes
The master dataset consumed 13 unique governed source hashes. It retains 45,240 immutable source occurrences and reconciles them to 31,206 canonical listing events. A listing keeps its MLS identity. Different MLS numbers are never collapsed merely because the address is the same.
Overlap is substantial because later exports repeat and update earlier records. The master identifies 8,357 overlapping listing identities and 5,780 field conflicts. Raw values, normalized values, source-file identity and source-row lineage are retained so a later correction does not erase the earlier observation.
The master also preserves 17,925 relist-related rows and 118,857 observed status-event rows for audit. That does not create a complete public relist or status-transition history. Address reuse, missing unit identifiers and multi-unit properties can make address-level chains ambiguous. For that reason, this page does not publish a “failed to sell” rate.
Coverage by measure
| Measure | Supported public period | How it is used |
|---|---|---|
| New-listing events, sold-close events and flow SNLR | Partial from Sept. 11, 2015; complete monthly Oct. 2015–Aug. 2026 | Monthly history, annual totals, rolling 12-month trends, seasonality and complete-month highs/lows |
| Authoritative annual House sold counts and median close price | Full years 2021–2025; 2026 separately through Aug. 19 | Annual price history and count reconciliation |
| Monthly close-price median and quartiles | Mar.–Jul. 2026 | Recent price-distribution detail only |
| Sale-to-recorded-list median and above/at/below shares | Mar.–Jul. 2026 | Descriptive completed-transaction context only |
| Property details | Field- and year-specific | Not added to public comparisons unless coverage is checked for the exact field and period |
| Inventory, months of inventory, DOM/CDOM, no-sale outcomes | Not supported | Omitted |
Facts, calculations, interpretations and hypotheses
This page uses four labels in substance, even when they are not repeated beside every sentence:
- A fact is read directly from a publication-approved aggregate.
- A calculation is arithmetic performed on those released values, such as a year-over-year percentage.
- An interpretation explains what the observed relationship can reasonably mean for a buyer or seller.
- A contextual hypothesis is a possible explanation that would need other evidence. Hypotheses are not treated as findings here.
That distinction matters. MLS activity can show that the relationship between new listings and closings tightened. It cannot prove which economic, financial or household factors caused the change. For rate-policy chronology, use the Bank of Canada and mortgage-rate decision archive beside this page rather than turning timing into causal proof.
How the master dataset was rebuilt
The source chain combines historical Greater Sudbury area exports with overlapping rolling updates. Exact source hashes are consumed once. A later overlapping record can contribute a nonblank corrected value, but its absence from a newer extract is not treated as a deletion. Only affected periods are recalculated.
The recovered historical files are not byte-identical to an earlier nine-file registration. That is why the long activity layer is described as a conditional reconstruction. It is still useful: the rebuilt 2021–2025 House sold counts reconcile closely with the retained authoritative annual layer, differing by 2, 2, 4, 4 and 0 records respectively. The authoritative layer remains controlling for published annual sold counts and median prices from 2021 onward.
The largest conflict families occur in status and last-change snapshots, subtype mapping, DOM/CDOM and price/status-date fields. Those conflicts are preserved in the restricted audit layer. They are not papered over with a single unexplained value, and they are the reason several tempting metrics remain off the public page.
2015: The opening window
What the annual record says
The public activity record starts on September 11, so 2015 is not a calendar-year comparison. September contributes only a partial month. October is the first complete month and the correct starting point for month-to-month records.
How the year moved month by month
Within 2015, new-listing activity was highest in October 2015 at 220; sold-close activity was highest in October 2015 at 162. The monthly flow ratio ranged from 57.84% in November 2015 to 73.64% in October 2015. These are timing observations, not evidence that the busiest month caused a price or negotiation outcome.
| Month | New listings | Sold closings | Flow SNLR | Coverage |
|---|---|---|---|---|
| September 2015 | 169 | 113 | 66.86% | Partial Opening From 2015-09-11 |
| October 2015 | 220 | 162 | 73.64% | Complete Month |
| November 2015 | 204 | 118 | 57.84% | Complete Month |
| December 2015 | 135 | 82 | 60.74% | Complete Month |
Interpretation
The four-month opening is useful for continuity, but its annual total should never be ranked against a full year.
2016: The first complete year
What the annual record says
The first full calendar year recorded 3,198 new-listing events and 1,758 sold-close events. The annual flow SNLR was 54.97%. May produced 441 new listings, still the highest complete-month new-listing count in the series, while June recorded 230 sold closings.
How the year moved month by month
Within 2016, new-listing activity was highest in May 2016 at 441; sold-close activity was highest in June 2016 at 230. The monthly flow ratio ranged from 43.19% in February 2016 to 87.62% in December 2016. These are timing observations, not evidence that the busiest month caused a price or negotiation outcome.
| Month | New listings | Sold closings | Flow SNLR | Coverage |
|---|---|---|---|---|
| January 2016 | 189 | 82 | 43.39% | Complete Month |
| February 2016 | 213 | 92 | 43.19% | Complete Month |
| March 2016 | 289 | 127 | 43.94% | Complete Month |
| April 2016 | 283 | 161 | 56.89% | Complete Month |
| May 2016 | 441 | 205 | 46.49% | Complete Month |
| June 2016 | 377 | 230 | 61.01% | Complete Month |
| July 2016 | 281 | 179 | 63.70% | Complete Month |
| August 2016 | 304 | 165 | 54.28% | Complete Month |
| September 2016 | 284 | 157 | 55.28% | Complete Month |
| October 2016 | 231 | 160 | 69.26% | Complete Month |
| November 2016 | 201 | 108 | 53.73% | Complete Month |
| December 2016 | 105 | 92 | 87.62% | Complete Month |
Interpretation
The first full year establishes the activity baseline. It does not include a complete citywide closing-price series, so no 2016 median price is published.
2017: Sales held while new supply eased
What the annual record says
New-listing events declined to 2,979, while sold-close events were nearly unchanged at 1,752. The annual flow SNLR rose to 58.81%. January recorded the series-low complete-month flow ratio of 36.41%; December ended at 83.67%.
How the year moved month by month
Within 2017, new-listing activity was highest in May 2017 at 382; sold-close activity was highest in August 2017 at 223. The monthly flow ratio ranged from 36.41% in January 2017 to 83.67% in December 2017. These are timing observations, not evidence that the busiest month caused a price or negotiation outcome.
| Month | New listings | Sold closings | Flow SNLR | Coverage |
|---|---|---|---|---|
| January 2017 | 217 | 79 | 36.41% | Complete Month |
| February 2017 | 181 | 87 | 48.07% | Complete Month |
| March 2017 | 276 | 146 | 52.90% | Complete Month |
| April 2017 | 287 | 138 | 48.08% | Complete Month |
| May 2017 | 382 | 161 | 42.15% | Complete Month |
| June 2017 | 310 | 166 | 53.55% | Complete Month |
| July 2017 | 283 | 183 | 64.66% | Complete Month |
| August 2017 | 292 | 223 | 76.37% | Complete Month |
| September 2017 | 258 | 202 | 78.29% | Complete Month |
| October 2017 | 230 | 150 | 65.22% | Complete Month |
| November 2017 | 165 | 135 | 81.82% | Complete Month |
| December 2017 | 98 | 82 | 83.67% | Complete Month |
Interpretation
The annual relationship tightened because the new-listing flow fell more than the sold-closing flow. The monthly spread also shows why one ratio should not stand in for the whole year.
2018: Sold-closing flow rose while new-listing flow fell
What the annual record says
New-listing events declined again, to 2,769. Sold-close events rose 3.60% to 1,815. The annual flow SNLR reached 65.55%. May was the highest new-listing month at 345, and June was the highest sold-closing month at 213.
How the year moved month by month
Within 2018, new-listing activity was highest in May 2018 at 345; sold-close activity was highest in June 2018 at 213. The monthly flow ratio ranged from 45.33% in January 2018 to 91.43% in December 2018. These are timing observations, not evidence that the busiest month caused a price or negotiation outcome.
| Month | New listings | Sold closings | Flow SNLR | Coverage |
|---|---|---|---|---|
| January 2018 | 225 | 102 | 45.33% | Complete Month |
| February 2018 | 158 | 106 | 67.09% | Complete Month |
| March 2018 | 248 | 140 | 56.45% | Complete Month |
| April 2018 | 287 | 179 | 62.37% | Complete Month |
| May 2018 | 345 | 189 | 54.78% | Complete Month |
| June 2018 | 323 | 213 | 65.94% | Complete Month |
| July 2018 | 289 | 199 | 68.86% | Complete Month |
| August 2018 | 251 | 178 | 70.92% | Complete Month |
| September 2018 | 209 | 158 | 75.60% | Complete Month |
| October 2018 | 218 | 171 | 78.44% | Complete Month |
| November 2018 | 146 | 116 | 79.45% | Complete Month |
| December 2018 | 70 | 64 | 91.43% | Complete Month |
Interpretation
The activity relationship continued to tighten. Without complete historical price coverage, this chapter does not infer how values moved.
2019: Tightening continued before the exceptional years
What the annual record says
Annual new-listing events fell to 2,558 while sold-close events rose 3.47% to 1,878. The flow SNLR reached 73.42%. December recorded 77 new listings and 93 sold closings, producing a 120.78% monthly flow ratio.
How the year moved month by month
Within 2019, new-listing activity was highest in May 2019 at 326; sold-close activity was highest in July 2019 at 217. The monthly flow ratio ranged from 42.44% in January 2019 to 120.78% in December 2019. These are timing observations, not evidence that the busiest month caused a price or negotiation outcome.
| Month | New listings | Sold closings | Flow SNLR | Coverage |
|---|---|---|---|---|
| January 2019 | 172 | 73 | 42.44% | Complete Month |
| February 2019 | 145 | 98 | 67.59% | Complete Month |
| March 2019 | 191 | 131 | 68.59% | Complete Month |
| April 2019 | 255 | 150 | 58.82% | Complete Month |
| May 2019 | 326 | 207 | 63.50% | Complete Month |
| June 2019 | 303 | 210 | 69.31% | Complete Month |
| July 2019 | 279 | 217 | 77.78% | Complete Month |
| August 2019 | 241 | 190 | 78.84% | Complete Month |
| September 2019 | 227 | 185 | 81.50% | Complete Month |
| October 2019 | 192 | 198 | 103.12% | Complete Month |
| November 2019 | 150 | 126 | 84.00% | Complete Month |
| December 2019 | 77 | 93 | 120.78% | Complete Month |
Interpretation
A monthly ratio above 100% does not mean more than every new listing sold. Closings in December can come from homes listed in earlier months.
2020: Fewer new listings, more sold closings
What the annual record says
The activity series records 2,327 new-listing events and 1,967 sold-close events, a 4.74% increase in sold closings from 2019. The annual flow SNLR rose to 84.53%. June was the busiest closing month at 266. December produced the series-high complete-month flow ratio of 150.00%, with 78 new listings and 117 sold closings.
How the year moved month by month
Within 2020, new-listing activity was highest in June 2020 at 307; sold-close activity was highest in June 2020 at 266. The monthly flow ratio ranged from 54.01% in January 2020 to 150.00% in December 2020. These are timing observations, not evidence that the busiest month caused a price or negotiation outcome.
| Month | New listings | Sold closings | Flow SNLR | Coverage |
|---|---|---|---|---|
| January 2020 | 137 | 74 | 54.01% | Complete Month |
| February 2020 | 174 | 130 | 74.71% | Complete Month |
| March 2020 | 197 | 132 | 67.01% | Complete Month |
| April 2020 | 94 | 80 | 85.11% | Complete Month |
| May 2020 | 198 | 129 | 65.15% | Complete Month |
| June 2020 | 307 | 266 | 86.64% | Complete Month |
| July 2020 | 261 | 251 | 96.17% | Complete Month |
| August 2020 | 239 | 213 | 89.12% | Complete Month |
| September 2020 | 275 | 215 | 78.18% | Complete Month |
| October 2020 | 217 | 202 | 93.09% | Complete Month |
| November 2020 | 150 | 158 | 105.33% | Complete Month |
| December 2020 | 78 | 117 | 150.00% | Complete Month |
Interpretation
The activity record shows a marked tightening in the two flows. It does not support a complete 2020 citywide House median, and it cannot assign a cause to the change.
2021: The activity peak in this record
What the annual record says
Conditional sold-close events rose 19.52% to 2,351; the authoritative retained count is 2,353. New-listing events rose to 2,602. The annual flow SNLR reached 90.35%. May recorded 276 sold closings, the highest complete-month sold count in the series. The authoritative annual median House close price was $365,000.
How the year moved month by month
Within 2021, new-listing activity was highest in April 2021 at 345; sold-close activity was highest in May 2021 at 276. The monthly flow ratio ranged from 74.49% in April 2021 to 116.16% in December 2021. These are timing observations, not evidence that the busiest month caused a price or negotiation outcome.
| Month | New listings | Sold closings | Flow SNLR | Coverage |
|---|---|---|---|---|
| January 2021 | 131 | 107 | 81.68% | Complete Month |
| February 2021 | 155 | 148 | 95.48% | Complete Month |
| March 2021 | 310 | 257 | 82.90% | Complete Month |
| April 2021 | 345 | 257 | 74.49% | Complete Month |
| May 2021 | 330 | 276 | 83.64% | Complete Month |
| June 2021 | 312 | 274 | 87.82% | Complete Month |
| July 2021 | 206 | 200 | 97.09% | Complete Month |
| August 2021 | 197 | 195 | 98.98% | Complete Month |
| September 2021 | 182 | 181 | 99.45% | Complete Month |
| October 2021 | 182 | 183 | 100.55% | Complete Month |
| November 2021 | 153 | 158 | 103.27% | Complete Month |
| December 2021 | 99 | 115 | 116.16% | Complete Month |
Interpretation
This is the strongest annual closing activity in the available history. It is also the first year with a controlling citywide House median, so price comparisons begin here rather than being backfilled from incomplete older price fields.
Authoritative annual price/count layer
The controlling annual layer records 2,353 House sold closings and a median close price of $365,000 for the full year.
2022: A sharp activity reset, with a higher annual median
What the annual record says
Authoritative House sold closings fell 18.10% to 1,927. Conditional new listings declined to 2,471, and the annual flow SNLR moved down to 77.90%. The authoritative median close price rose 18.08% to $431,000. December recorded just 50 new listings—the lowest complete-month new-listing count in the series—and 74 sold closings.
How the year moved month by month
Within 2022, new-listing activity was highest in June 2022 at 332; sold-close activity was highest in May 2022 at 239. The monthly flow ratio ranged from 65.06% in June 2022 to 148.00% in December 2022. These are timing observations, not evidence that the busiest month caused a price or negotiation outcome.
| Month | New listings | Sold closings | Flow SNLR | Coverage |
|---|---|---|---|---|
| January 2022 | 137 | 104 | 75.91% | Complete Month |
| February 2022 | 174 | 138 | 79.31% | Complete Month |
| March 2022 | 246 | 198 | 80.49% | Complete Month |
| April 2022 | 256 | 181 | 70.70% | Complete Month |
| May 2022 | 318 | 239 | 75.16% | Complete Month |
| June 2022 | 332 | 216 | 65.06% | Complete Month |
| July 2022 | 250 | 195 | 78.00% | Complete Month |
| August 2022 | 226 | 172 | 76.11% | Complete Month |
| September 2022 | 176 | 174 | 98.86% | Complete Month |
| October 2022 | 159 | 111 | 69.81% | Complete Month |
| November 2022 | 147 | 123 | 83.67% | Complete Month |
| December 2022 | 50 | 74 | 148.00% | Complete Month |
Interpretation
The divergence is important: a lower number of transactions can coexist with a higher annual median. Volume and price are different dimensions of the market, and the median is also affected by the mix of homes that close.
Authoritative annual price/count layer
The controlling annual layer records 1,927 House sold closings and a median close price of $431,000 for the full year. The sold count changed -18.10% from the prior year, and the median changed 18.08%.
2023: The low-volume year and price stabilization
What the annual record says
Authoritative sold closings fell another 17.85% to 1,583, the lowest authoritative annual count in the 2021–2025 layer. Conditional activity records 2,208 new listings and 1,579 sold closings, both the lowest full-year totals in the 2016–2025 reconstruction. The annual flow SNLR was 71.51%. The median close price edged up 0.90% to $434,900. January recorded 62 sold closings, the lowest complete-month sold count in the series.
How the year moved month by month
Within 2023, new-listing activity was highest in June 2023 at 272; sold-close activity was highest in June 2023 at 200. The monthly flow ratio ranged from 42.18% in January 2023 to 128.57% in December 2023. These are timing observations, not evidence that the busiest month caused a price or negotiation outcome.
| Month | New listings | Sold closings | Flow SNLR | Coverage |
|---|---|---|---|---|
| January 2023 | 147 | 62 | 42.18% | Complete Month |
| February 2023 | 114 | 94 | 82.46% | Complete Month |
| March 2023 | 164 | 134 | 81.71% | Complete Month |
| April 2023 | 154 | 120 | 77.92% | Complete Month |
| May 2023 | 241 | 162 | 67.22% | Complete Month |
| June 2023 | 272 | 200 | 73.53% | Complete Month |
| July 2023 | 237 | 180 | 75.95% | Complete Month |
| August 2023 | 214 | 165 | 77.10% | Complete Month |
| September 2023 | 227 | 137 | 60.35% | Complete Month |
| October 2023 | 240 | 131 | 54.58% | Complete Month |
| November 2023 | 142 | 122 | 85.92% | Complete Month |
| December 2023 | 56 | 72 | 128.57% | Complete Month |
Interpretation
The annual median was comparatively stable while completed transaction volume contracted. That is a better description than calling the year simply up or down.
Authoritative annual price/count layer
The controlling annual layer records 1,583 House sold closings and a median close price of $434,900 for the full year. The sold count changed -17.85% from the prior year, and the median changed 0.90%.
2024: Activity recovered and the median advanced
What the annual record says
Authoritative House sold closings rose 13.90% to 1,803. Conditional new listings rose to 2,332, while the annual flow SNLR increased to 77.14%. The authoritative median close price rose 7.33% to $466,789. May was the busiest month for both new listings and sold closings, at 308 and 218.
How the year moved month by month
Within 2024, new-listing activity was highest in May 2024 at 308; sold-close activity was highest in May 2024 at 218. The monthly flow ratio ranged from 65.60% in January 2024 to 134.62% in December 2024. These are timing observations, not evidence that the busiest month caused a price or negotiation outcome.
| Month | New listings | Sold closings | Flow SNLR | Coverage |
|---|---|---|---|---|
| January 2024 | 125 | 82 | 65.60% | Complete Month |
| February 2024 | 143 | 115 | 80.42% | Complete Month |
| March 2024 | 152 | 123 | 80.92% | Complete Month |
| April 2024 | 271 | 186 | 68.63% | Complete Month |
| May 2024 | 308 | 218 | 70.78% | Complete Month |
| June 2024 | 269 | 196 | 72.86% | Complete Month |
| July 2024 | 241 | 182 | 75.52% | Complete Month |
| August 2024 | 194 | 162 | 83.51% | Complete Month |
| September 2024 | 239 | 171 | 71.55% | Complete Month |
| October 2024 | 195 | 168 | 86.15% | Complete Month |
| November 2024 | 143 | 126 | 88.11% | Complete Month |
| December 2024 | 52 | 70 | 134.62% | Complete Month |
Interpretation
The year brought more completed activity than 2023 and a higher annual median. It did not return to the 2021 closing count, and the citywide median still does not describe the path of every property.
Authoritative annual price/count layer
The controlling annual layer records 1,803 House sold closings and a median close price of $466,789 for the full year. The sold count changed 13.90% from the prior year, and the median changed 7.33%.
2025: The recovery continued at a slower pace
What the annual record says
Authoritative House sold closings rose 3.99% to 1,875. Conditional new listings increased to 2,493 and conditional sold closings also totaled 1,875. The annual flow SNLR was 75.21%. The authoritative median close price rose 3.99% to $485,404. September was the busiest new-listing month at 315, while June had the most sold closings at 215.
How the year moved month by month
Within 2025, new-listing activity was highest in September 2025 at 315; sold-close activity was highest in June 2025 at 215. The monthly flow ratio ranged from 65.70% in March 2025 to 118.18% in December 2025. These are timing observations, not evidence that the busiest month caused a price or negotiation outcome.
| Month | New listings | Sold closings | Flow SNLR | Coverage |
|---|---|---|---|---|
| January 2025 | 118 | 78 | 66.10% | Complete Month |
| February 2025 | 130 | 95 | 73.08% | Complete Month |
| March 2025 | 172 | 113 | 65.70% | Complete Month |
| April 2025 | 259 | 183 | 70.66% | Complete Month |
| May 2025 | 281 | 206 | 73.31% | Complete Month |
| June 2025 | 279 | 215 | 77.06% | Complete Month |
| July 2025 | 271 | 201 | 74.17% | Complete Month |
| August 2025 | 216 | 168 | 77.78% | Complete Month |
| September 2025 | 315 | 215 | 68.25% | Complete Month |
| October 2025 | 228 | 187 | 82.02% | Complete Month |
| November 2025 | 158 | 136 | 86.08% | Complete Month |
| December 2025 | 66 | 78 | 118.18% | Complete Month |
Interpretation
Activity improved again, though the annual flow ratio was slightly lower than in 2024 because new listings grew faster than sold closings. That describes the balance between two annual event flows; it does not establish how many homes were available to buyers at any point.
Authoritative annual price/count layer
The controlling annual layer records 1,875 House sold closings and a median close price of $485,404 for the full year. The sold count changed 3.99% from the prior year, and the median changed 3.99%.
2026: A partial-year view, not a forecast
What the annual record says
Through August 31, the conditional activity layer records 1,736 new-listing events and 1,189 sold-close events, for a 68.49% flow SNLR. Through August 19, the authoritative layer records 1,122 House sold closings and a $500,000 median close price. June was the busiest month so far, with 355 new listings and 244 sold closings. The monthly flow ratio rose to 79.42% in July and moved to 64.32% in August.
How the year moved month by month
Within 2026, new-listing activity was highest in June 2026 at 355; sold-close activity was highest in June 2026 at 244. The monthly flow ratio ranged from 57.32% in May 2026 to 84.95% in January 2026. These are timing observations, not evidence that the busiest month caused a price or negotiation outcome.
| Month | New listings | Sold closings | Flow SNLR | Coverage |
|---|---|---|---|---|
| January 2026 | 93 | 79 | 84.95% | Complete Month |
| February 2026 | 131 | 91 | 69.47% | Complete Month |
| March 2026 | 138 | 101 | 73.19% | Complete Month |
| April 2026 | 173 | 111 | 64.16% | Complete Month |
| May 2026 | 328 | 188 | 57.32% | Complete Month |
| June 2026 | 355 | 244 | 68.73% | Complete Month |
| July 2026 | 277 | 220 | 79.42% | Complete Month |
| August 2026 | 241 | 155 | 64.32% | Complete Month |
Interpretation
The different August cutoffs are deliberate. Activity is complete through August 31; annual price stops at August 19; monthly price and recorded-list detail stops in July. None of the partial-year figures should be annualized into a forecast.
Authoritative annual price/count layer
The controlling annual layer records 1,122 House sold closings and a median close price of $500,000 for the period through August 19.
Rolling 12-month trends
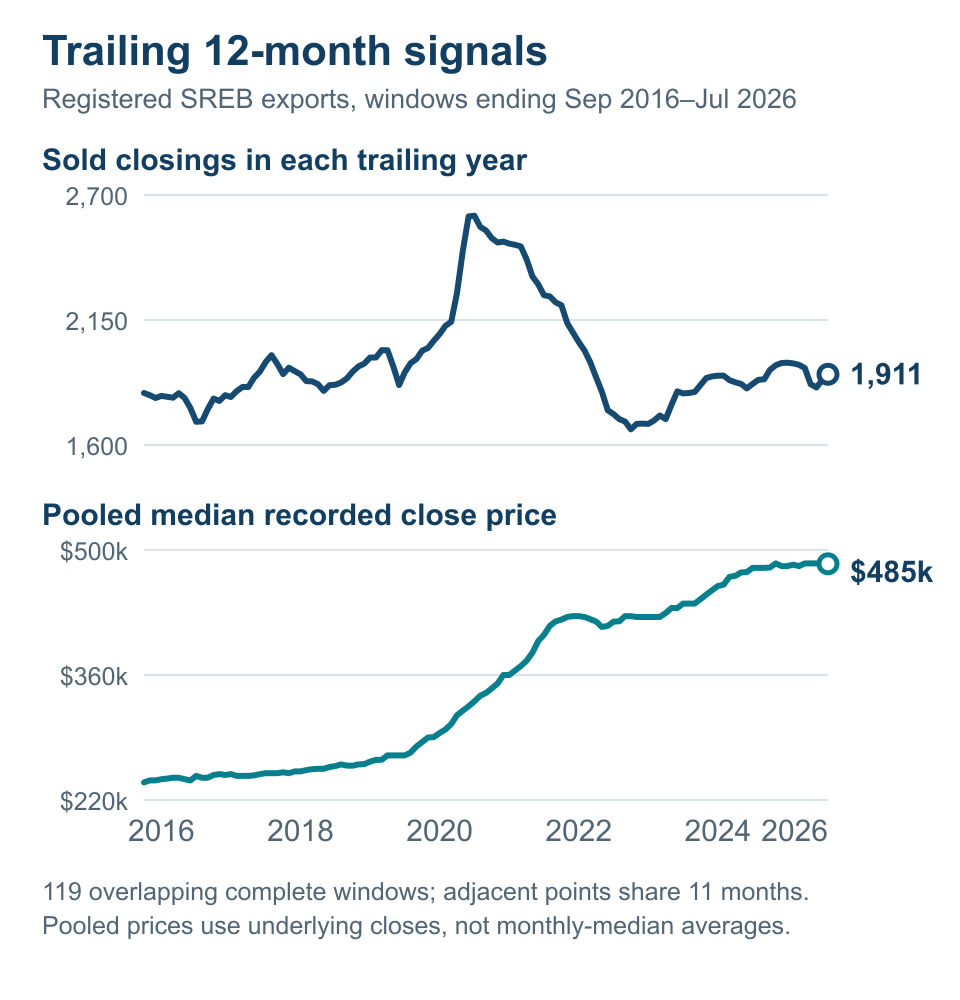
Each point totals twelve consecutive complete months; adjacent points share eleven months. See the rolling 12-month House activity table for exact values.
This flow ratio is not inventory, absorption or same-listing conversion. See the rolling trends table for exact values.
Monthly Greater Sudbury activity is seasonal. A rolling 12-month view reduces that visual noise by adding twelve consecutive complete months at every point.
The first complete window, October 2015 through September 2016, recorded 3,220 new-listing events and 1,760 sold-close events, for a 54.66% flow ratio. The latest window, September 2025 through August 2026, recorded 2,503 new listings and 1,805 sold closings, for a 72.11% flow ratio.
The rolling series is useful for locating broad transitions. It still does not measure inventory, and adjacent rows share eleven months of data. A small change from one rolling row to the next is therefore not twelve months of entirely new evidence.
View all rolling 12-month values
| Window start | Window end | New listings | Sold closings | Flow SNLR |
|---|---|---|---|---|
| 2015-10 | 2016-09 | 3,220 | 1,760 | 54.66% |
| 2015-11 | 2016-10 | 3,231 | 1,758 | 54.41% |
| 2015-12 | 2016-11 | 3,228 | 1,748 | 54.15% |
| 2016-01 | 2016-12 | 3,198 | 1,758 | 54.97% |
| 2016-02 | 2017-01 | 3,226 | 1,755 | 54.40% |
| 2016-03 | 2017-02 | 3,194 | 1,750 | 54.79% |
| 2016-04 | 2017-03 | 3,181 | 1,769 | 55.61% |
| 2016-05 | 2017-04 | 3,185 | 1,746 | 54.82% |
| 2016-06 | 2017-05 | 3,126 | 1,702 | 54.45% |
| 2016-07 | 2017-06 | 3,059 | 1,638 | 53.55% |
| 2016-08 | 2017-07 | 3,061 | 1,642 | 53.64% |
| 2016-09 | 2017-08 | 3,049 | 1,700 | 55.76% |
| 2016-10 | 2017-09 | 3,023 | 1,745 | 57.72% |
| 2016-11 | 2017-10 | 3,022 | 1,735 | 57.41% |
| 2016-12 | 2017-11 | 2,986 | 1,762 | 59.01% |
| 2017-01 | 2017-12 | 2,979 | 1,752 | 58.81% |
| 2017-02 | 2018-01 | 2,987 | 1,775 | 59.42% |
| 2017-03 | 2018-02 | 2,964 | 1,794 | 60.53% |
| 2017-04 | 2018-03 | 2,936 | 1,788 | 60.90% |
| 2017-05 | 2018-04 | 2,936 | 1,829 | 62.30% |
| 2017-06 | 2018-05 | 2,899 | 1,857 | 64.06% |
| 2017-07 | 2018-06 | 2,912 | 1,904 | 65.38% |
| 2017-08 | 2018-07 | 2,918 | 1,920 | 65.80% |
| 2017-09 | 2018-08 | 2,877 | 1,875 | 65.17% |
| 2017-10 | 2018-09 | 2,828 | 1,831 | 64.75% |
| 2017-11 | 2018-10 | 2,816 | 1,852 | 65.77% |
| 2017-12 | 2018-11 | 2,797 | 1,833 | 65.53% |
| 2018-01 | 2018-12 | 2,769 | 1,815 | 65.55% |
| 2018-02 | 2019-01 | 2,716 | 1,786 | 65.76% |
| 2018-03 | 2019-02 | 2,703 | 1,778 | 65.78% |
| 2018-04 | 2019-03 | 2,646 | 1,769 | 66.86% |
| 2018-05 | 2019-04 | 2,614 | 1,740 | 66.56% |
| 2018-06 | 2019-05 | 2,595 | 1,758 | 67.75% |
| 2018-07 | 2019-06 | 2,575 | 1,755 | 68.16% |
| 2018-08 | 2019-07 | 2,565 | 1,773 | 69.12% |
| 2018-09 | 2019-08 | 2,555 | 1,785 | 69.86% |
| 2018-10 | 2019-09 | 2,573 | 1,812 | 70.42% |
| 2018-11 | 2019-10 | 2,547 | 1,839 | 72.20% |
| 2018-12 | 2019-11 | 2,551 | 1,849 | 72.48% |
| 2019-01 | 2019-12 | 2,558 | 1,878 | 73.42% |
| 2019-02 | 2020-01 | 2,523 | 1,879 | 74.47% |
| 2019-03 | 2020-02 | 2,552 | 1,911 | 74.88% |
| 2019-04 | 2020-03 | 2,558 | 1,912 | 74.75% |
| 2019-05 | 2020-04 | 2,397 | 1,842 | 76.85% |
| 2019-06 | 2020-05 | 2,269 | 1,764 | 77.74% |
| 2019-07 | 2020-06 | 2,273 | 1,820 | 80.07% |
| 2019-08 | 2020-07 | 2,255 | 1,854 | 82.22% |
| 2019-09 | 2020-08 | 2,253 | 1,877 | 83.31% |
| 2019-10 | 2020-09 | 2,301 | 1,907 | 82.88% |
| 2019-11 | 2020-10 | 2,326 | 1,911 | 82.16% |
| 2019-12 | 2020-11 | 2,326 | 1,943 | 83.53% |
| 2020-01 | 2020-12 | 2,327 | 1,967 | 84.53% |
| 2020-02 | 2021-01 | 2,321 | 2,000 | 86.17% |
| 2020-03 | 2021-02 | 2,302 | 2,018 | 87.66% |
| 2020-04 | 2021-03 | 2,415 | 2,143 | 88.74% |
| 2020-05 | 2021-04 | 2,666 | 2,320 | 87.02% |
| 2020-06 | 2021-05 | 2,798 | 2,467 | 88.17% |
| 2020-07 | 2021-06 | 2,803 | 2,475 | 88.30% |
| 2020-08 | 2021-07 | 2,748 | 2,424 | 88.21% |
| 2020-09 | 2021-08 | 2,706 | 2,406 | 88.91% |
| 2020-10 | 2021-09 | 2,613 | 2,372 | 90.78% |
| 2020-11 | 2021-10 | 2,578 | 2,353 | 91.27% |
| 2020-12 | 2021-11 | 2,581 | 2,353 | 91.17% |
| 2021-01 | 2021-12 | 2,602 | 2,351 | 90.35% |
| 2021-02 | 2022-01 | 2,608 | 2,348 | 90.03% |
| 2021-03 | 2022-02 | 2,627 | 2,338 | 89.00% |
| 2021-04 | 2022-03 | 2,563 | 2,279 | 88.92% |
| 2021-05 | 2022-04 | 2,474 | 2,203 | 89.05% |
| 2021-06 | 2022-05 | 2,462 | 2,166 | 87.98% |
| 2021-07 | 2022-06 | 2,482 | 2,108 | 84.93% |
| 2021-08 | 2022-07 | 2,526 | 2,103 | 83.25% |
| 2021-09 | 2022-08 | 2,555 | 2,080 | 81.41% |
| 2021-10 | 2022-09 | 2,549 | 2,073 | 81.33% |
| 2021-11 | 2022-10 | 2,526 | 2,001 | 79.22% |
| 2021-12 | 2022-11 | 2,520 | 1,966 | 78.02% |
| 2022-01 | 2022-12 | 2,471 | 1,925 | 77.90% |
| 2022-02 | 2023-01 | 2,481 | 1,883 | 75.90% |
| 2022-03 | 2023-02 | 2,421 | 1,839 | 75.96% |
| 2022-04 | 2023-03 | 2,339 | 1,775 | 75.89% |
| 2022-05 | 2023-04 | 2,237 | 1,714 | 76.62% |
| 2022-06 | 2023-05 | 2,160 | 1,637 | 75.79% |
| 2022-07 | 2023-06 | 2,100 | 1,621 | 77.19% |
| 2022-08 | 2023-07 | 2,087 | 1,606 | 76.95% |
| 2022-09 | 2023-08 | 2,075 | 1,599 | 77.06% |
| 2022-10 | 2023-09 | 2,126 | 1,562 | 73.47% |
| 2022-11 | 2023-10 | 2,207 | 1,582 | 71.68% |
| 2022-12 | 2023-11 | 2,202 | 1,581 | 71.80% |
| 2023-01 | 2023-12 | 2,208 | 1,579 | 71.51% |
| 2023-02 | 2024-01 | 2,186 | 1,599 | 73.15% |
| 2023-03 | 2024-02 | 2,215 | 1,620 | 73.14% |
| 2023-04 | 2024-03 | 2,203 | 1,609 | 73.04% |
| 2023-05 | 2024-04 | 2,320 | 1,675 | 72.20% |
| 2023-06 | 2024-05 | 2,387 | 1,731 | 72.52% |
| 2023-07 | 2024-06 | 2,384 | 1,727 | 72.44% |
| 2023-08 | 2024-07 | 2,388 | 1,729 | 72.40% |
| 2023-09 | 2024-08 | 2,368 | 1,726 | 72.89% |
| 2023-10 | 2024-09 | 2,380 | 1,760 | 73.95% |
| 2023-11 | 2024-10 | 2,335 | 1,797 | 76.96% |
| 2023-12 | 2024-11 | 2,336 | 1,801 | 77.10% |
| 2024-01 | 2024-12 | 2,332 | 1,799 | 77.14% |
| 2024-02 | 2025-01 | 2,325 | 1,795 | 77.20% |
| 2024-03 | 2025-02 | 2,312 | 1,775 | 76.77% |
| 2024-04 | 2025-03 | 2,332 | 1,765 | 75.69% |
| 2024-05 | 2025-04 | 2,320 | 1,762 | 75.95% |
| 2024-06 | 2025-05 | 2,293 | 1,750 | 76.32% |
| 2024-07 | 2025-06 | 2,303 | 1,769 | 76.81% |
| 2024-08 | 2025-07 | 2,333 | 1,788 | 76.64% |
| 2024-09 | 2025-08 | 2,355 | 1,794 | 76.18% |
| 2024-10 | 2025-09 | 2,431 | 1,838 | 75.61% |
| 2024-11 | 2025-10 | 2,464 | 1,857 | 75.37% |
| 2024-12 | 2025-11 | 2,479 | 1,867 | 75.31% |
| 2025-01 | 2025-12 | 2,493 | 1,875 | 75.21% |
| 2025-02 | 2026-01 | 2,468 | 1,876 | 76.01% |
| 2025-03 | 2026-02 | 2,469 | 1,872 | 75.82% |
| 2025-04 | 2026-03 | 2,435 | 1,860 | 76.39% |
| 2025-05 | 2026-04 | 2,349 | 1,788 | 76.12% |
| 2025-06 | 2026-05 | 2,396 | 1,770 | 73.87% |
| 2025-07 | 2026-06 | 2,472 | 1,799 | 72.78% |
| 2025-08 | 2026-07 | 2,478 | 1,818 | 73.37% |
| 2025-09 | 2026-08 | 2,503 | 1,805 | 72.11% |
Seasonality across the ten complete years
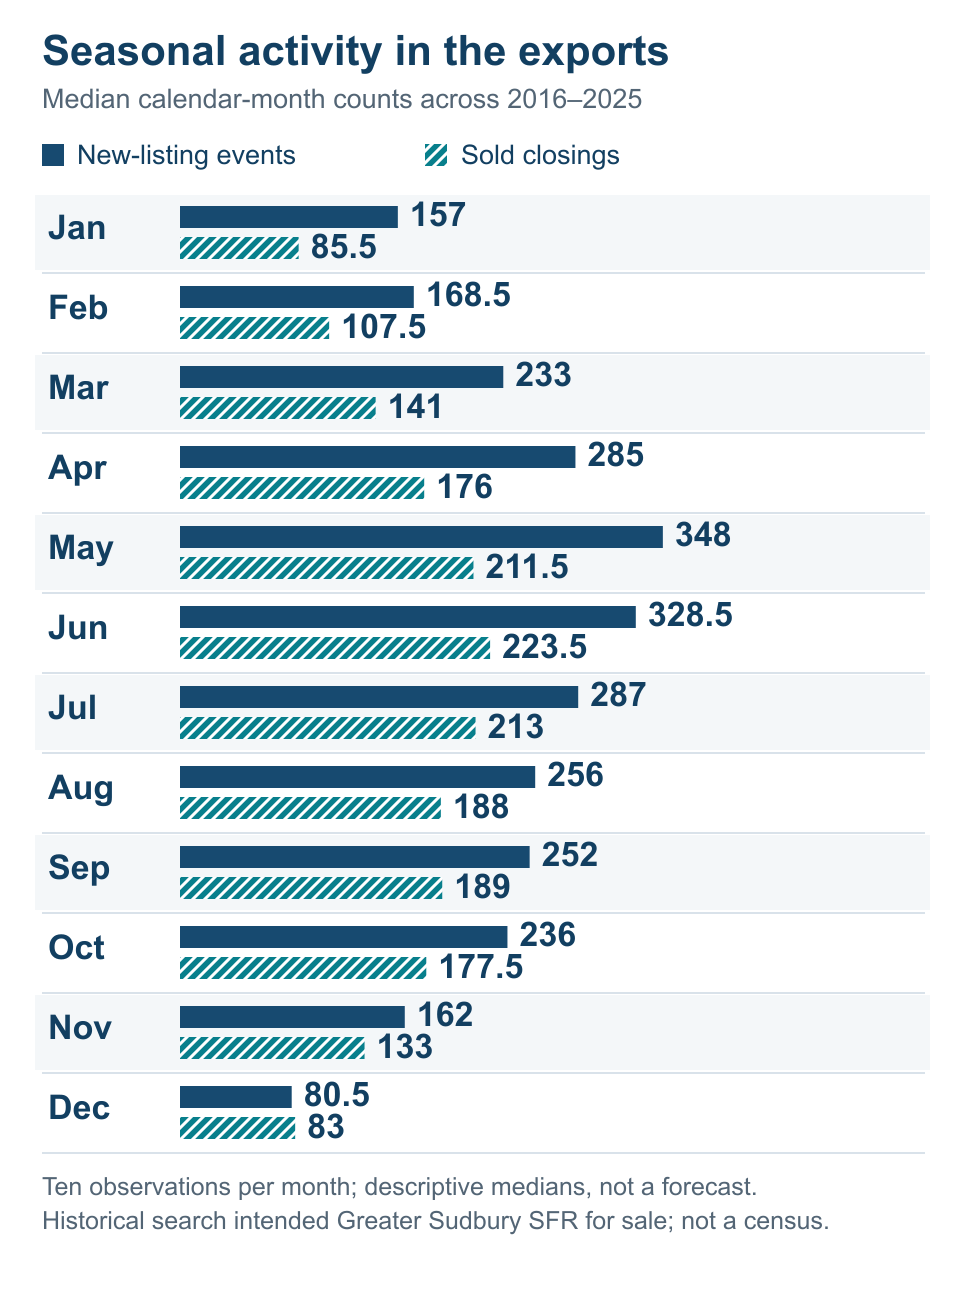
Bars show calendar-month medians across ten complete years and are descriptive, not a forecast. See the seasonality table for exact values.
The 2016–2025 calendar-month medians show a broad pattern in the calendar-month medians. May had the highest median new-listing flow at 322.0. June had the highest median sold-close flow at 214.0. December had the lowest median new-listing flow at 73.5 and the lowest median sold-close flow at 80.0.
The median monthly flow ratio was highest in December at 119.48%. That does not mean December was automatically the strongest month for every seller. New listings typically fell sharply by year-end while closings could reflect agreements reached earlier. The ratio compares two monthly event flows, not the same group of properties.
Seasonality describes the historical timing of these two event flows; it is not a forecast or a direct measure of buyer competition. Property-specific timing still requires current inventory and comparable evidence. Use the Seller Experience or Buyer Experience to connect the aggregate calendar with a specific move.
| Calendar month | Sample years | Median new listings | Median sold closings | Median monthly SNLR | Observed new range | Observed sold range |
|---|---|---|---|---|---|---|
| January | 2016-2025 | 142.0 | 80.5 | 49.67% | 118–225 | 62–107 |
| February | 2016-2025 | 156.5 | 102.0 | 73.89% | 114–213 | 87–148 |
| March | 2016-2025 | 221.5 | 133.0 | 67.80% | 152–310 | 113–257 |
| April | 2016-2025 | 265.0 | 170.0 | 69.64% | 94–345 | 80–257 |
| May | 2016-2025 | 322.0 | 205.5 | 66.19% | 198–441 | 129–276 |
| June | 2016-2025 | 308.5 | 214.0 | 71.09% | 269–377 | 166–274 |
| July | 2016-2025 | 266.0 | 197.0 | 75.73% | 206–289 | 179–251 |
| August | 2016-2025 | 232.5 | 175.0 | 77.44% | 194–304 | 162–223 |
| September | 2016-2025 | 233.0 | 177.5 | 76.89% | 176–315 | 137–215 |
| October | 2016-2025 | 217.5 | 169.5 | 80.23% | 159–240 | 111–202 |
| November | 2016-2025 | 150.0 | 126.0 | 84.96% | 142–201 | 108–158 |
| December | 2016-2025 | 73.5 | 80.0 | 119.48% | 50–105 | 64–117 |
Recent price distribution and recorded-list comparisons
ListPrice is the retained export field and is not proven original or final list price. See the recent price and recorded-list table for exact values.
The current raw-source window supports a deeper monthly look from March through July 2026. The median close price ranged from $485,000 in July to $550,000 in April. The inclusive 25th and 75th percentiles show the middle half of each month's supported House closings, which is more informative than the median alone when the market contains very different price bands.
The median sale-to-recorded-list ratio moved from 100.03% in March to 101.27% in May and 99.62% in July. July's paired closings were 38.36% above the recorded list field, 10.05% at it and 51.60% below it.
ListPrice is the value retained in the export. It is not proven original list price or final list price across every record. These ratios do not count offers, reconstruct price changes or prove the quality of a seller's strategy. Financing, conditions, deposit, closing date and completion risk also matter. That is why the seller-performance analysis does not treat over-asking as the scorecard.
| Period | Sold closings | Valid close-price sample | Median | 25th percentile | 75th percentile | Paired list sample | Median sale/list | Above list | At list | Below list |
|---|---|---|---|---|---|---|---|---|---|---|
| March 2026 | 101 | 101 | $490,000 | $379,000 | $615,000 | 101 | 100.03% | 53.47% | 4.95% | 41.58% |
| April 2026 | 111 | 111 | $550,000 | $403,465 | $652,500 | 111 | 100.00% | 43.24% | 7.21% | 49.55% |
| May 2026 | 188 | 188 | $518,000 | $427,895 | $644,000 | 188 | 101.27% | 59.04% | 9.04% | 31.91% |
| June 2026 | 244 | 244 | $499,950 | $402,386 | $617,750 | 244 | 100.00% | 45.90% | 8.61% | 45.49% |
| July 2026 | 219 | 219 | $485,000 | $400,000 | $601,000 | 219 | 99.62% | 38.36% | 10.05% | 51.60% |
Complete-month records and lows
The extremes below use complete months from October 2015 through August 2026. They are descriptive records inside this dataset, not all-time Greater Sudbury records outside the stated coverage.
| Measure | Direction | Period | Value |
|---|---|---|---|
| New listing events | Low | December 2022 | 50 |
| New listing events | High | May 2016 | 441 |
| Sold close events | Low | January 2023 | 62 |
| Sold close events | High | May 2021 | 276 |
| Sales-to-new-listings ratio | Low | January 2017 | 36.41% |
| Sales-to-new-listings ratio | High | December 2020 | 150.00% |
The highest new-listing month and the highest sold-closing month occurred five years apart. The highest and lowest flow ratios occurred in winter months, when the new-listing denominator can be small. Those facts are useful warnings against reducing market history to one record month or one ratio.
Complete annual table
2021–2025 are full years; 2026 is partial through August 19. See the complete annual table for exact values.
The conditional activity columns come from the canonical reconstructed event master. The authoritative sold-count and median-price columns are populated only where the retained House fact layer supports them.
| Year | Coverage | Conditional new listings | Conditional sold closings | Conditional flow SNLR | Authoritative sold closings | Authoritative median | Authoritative sold YoY | Median YoY |
|---|---|---|---|---|---|---|---|---|
| 2015 | Partial from Sept. 11 | 728 | 475 | 65.25% | — | — | — | — |
| 2016 | Full year | 3,198 | 1,758 | 54.97% | — | — | — | — |
| 2017 | Full year | 2,979 | 1,752 | 58.81% | — | — | — | — |
| 2018 | Full year | 2,769 | 1,815 | 65.55% | — | — | — | — |
| 2019 | Full year | 2,558 | 1,878 | 73.42% | — | — | — | — |
| 2020 | Full year | 2,327 | 1,967 | 84.53% | — | — | — | — |
| 2021 | Full year | 2,602 | 2,351 | 90.35% | 2,353 | $365,000 | — | — |
| 2022 | Full year | 2,471 | 1,925 | 77.90% | 1,927 | $431,000 | -18.10% | 18.08% |
| 2023 | Full year | 2,208 | 1,579 | 71.51% | 1,583 | $434,900 | -17.85% | 0.90% |
| 2024 | Full year | 2,332 | 1,799 | 77.14% | 1,803 | $466,789 | 13.90% | 7.33% |
| 2025 | Full year | 2,493 | 1,875 | 75.21% | 1,875 | $485,404 | 3.99% | 3.99% |
| 2026 | Activity through Aug. 31; price through Aug. 19 | 1,736 | 1,189 | 68.49% | 1,122 | $500,000 | — | — |
Complete monthly activity table
The table below contains every public monthly activity value. September 2015 is visibly partial; October 2015 through August 2026 are complete months.
Open the full monthly table
| Period | Coverage | New listings | Sold closings | Flow SNLR |
|---|---|---|---|---|
| September 2015 | Partial Opening From 2015-09-11 | 169 | 113 | 66.86% |
| October 2015 | Complete Month | 220 | 162 | 73.64% |
| November 2015 | Complete Month | 204 | 118 | 57.84% |
| December 2015 | Complete Month | 135 | 82 | 60.74% |
| January 2016 | Complete Month | 189 | 82 | 43.39% |
| February 2016 | Complete Month | 213 | 92 | 43.19% |
| March 2016 | Complete Month | 289 | 127 | 43.94% |
| April 2016 | Complete Month | 283 | 161 | 56.89% |
| May 2016 | Complete Month | 441 | 205 | 46.49% |
| June 2016 | Complete Month | 377 | 230 | 61.01% |
| July 2016 | Complete Month | 281 | 179 | 63.70% |
| August 2016 | Complete Month | 304 | 165 | 54.28% |
| September 2016 | Complete Month | 284 | 157 | 55.28% |
| October 2016 | Complete Month | 231 | 160 | 69.26% |
| November 2016 | Complete Month | 201 | 108 | 53.73% |
| December 2016 | Complete Month | 105 | 92 | 87.62% |
| January 2017 | Complete Month | 217 | 79 | 36.41% |
| February 2017 | Complete Month | 181 | 87 | 48.07% |
| March 2017 | Complete Month | 276 | 146 | 52.90% |
| April 2017 | Complete Month | 287 | 138 | 48.08% |
| May 2017 | Complete Month | 382 | 161 | 42.15% |
| June 2017 | Complete Month | 310 | 166 | 53.55% |
| July 2017 | Complete Month | 283 | 183 | 64.66% |
| August 2017 | Complete Month | 292 | 223 | 76.37% |
| September 2017 | Complete Month | 258 | 202 | 78.29% |
| October 2017 | Complete Month | 230 | 150 | 65.22% |
| November 2017 | Complete Month | 165 | 135 | 81.82% |
| December 2017 | Complete Month | 98 | 82 | 83.67% |
| January 2018 | Complete Month | 225 | 102 | 45.33% |
| February 2018 | Complete Month | 158 | 106 | 67.09% |
| March 2018 | Complete Month | 248 | 140 | 56.45% |
| April 2018 | Complete Month | 287 | 179 | 62.37% |
| May 2018 | Complete Month | 345 | 189 | 54.78% |
| June 2018 | Complete Month | 323 | 213 | 65.94% |
| July 2018 | Complete Month | 289 | 199 | 68.86% |
| August 2018 | Complete Month | 251 | 178 | 70.92% |
| September 2018 | Complete Month | 209 | 158 | 75.60% |
| October 2018 | Complete Month | 218 | 171 | 78.44% |
| November 2018 | Complete Month | 146 | 116 | 79.45% |
| December 2018 | Complete Month | 70 | 64 | 91.43% |
| January 2019 | Complete Month | 172 | 73 | 42.44% |
| February 2019 | Complete Month | 145 | 98 | 67.59% |
| March 2019 | Complete Month | 191 | 131 | 68.59% |
| April 2019 | Complete Month | 255 | 150 | 58.82% |
| May 2019 | Complete Month | 326 | 207 | 63.50% |
| June 2019 | Complete Month | 303 | 210 | 69.31% |
| July 2019 | Complete Month | 279 | 217 | 77.78% |
| August 2019 | Complete Month | 241 | 190 | 78.84% |
| September 2019 | Complete Month | 227 | 185 | 81.50% |
| October 2019 | Complete Month | 192 | 198 | 103.12% |
| November 2019 | Complete Month | 150 | 126 | 84.00% |
| December 2019 | Complete Month | 77 | 93 | 120.78% |
| January 2020 | Complete Month | 137 | 74 | 54.01% |
| February 2020 | Complete Month | 174 | 130 | 74.71% |
| March 2020 | Complete Month | 197 | 132 | 67.01% |
| April 2020 | Complete Month | 94 | 80 | 85.11% |
| May 2020 | Complete Month | 198 | 129 | 65.15% |
| June 2020 | Complete Month | 307 | 266 | 86.64% |
| July 2020 | Complete Month | 261 | 251 | 96.17% |
| August 2020 | Complete Month | 239 | 213 | 89.12% |
| September 2020 | Complete Month | 275 | 215 | 78.18% |
| October 2020 | Complete Month | 217 | 202 | 93.09% |
| November 2020 | Complete Month | 150 | 158 | 105.33% |
| December 2020 | Complete Month | 78 | 117 | 150.00% |
| January 2021 | Complete Month | 131 | 107 | 81.68% |
| February 2021 | Complete Month | 155 | 148 | 95.48% |
| March 2021 | Complete Month | 310 | 257 | 82.90% |
| April 2021 | Complete Month | 345 | 257 | 74.49% |
| May 2021 | Complete Month | 330 | 276 | 83.64% |
| June 2021 | Complete Month | 312 | 274 | 87.82% |
| July 2021 | Complete Month | 206 | 200 | 97.09% |
| August 2021 | Complete Month | 197 | 195 | 98.98% |
| September 2021 | Complete Month | 182 | 181 | 99.45% |
| October 2021 | Complete Month | 182 | 183 | 100.55% |
| November 2021 | Complete Month | 153 | 158 | 103.27% |
| December 2021 | Complete Month | 99 | 115 | 116.16% |
| January 2022 | Complete Month | 137 | 104 | 75.91% |
| February 2022 | Complete Month | 174 | 138 | 79.31% |
| March 2022 | Complete Month | 246 | 198 | 80.49% |
| April 2022 | Complete Month | 256 | 181 | 70.70% |
| May 2022 | Complete Month | 318 | 239 | 75.16% |
| June 2022 | Complete Month | 332 | 216 | 65.06% |
| July 2022 | Complete Month | 250 | 195 | 78.00% |
| August 2022 | Complete Month | 226 | 172 | 76.11% |
| September 2022 | Complete Month | 176 | 174 | 98.86% |
| October 2022 | Complete Month | 159 | 111 | 69.81% |
| November 2022 | Complete Month | 147 | 123 | 83.67% |
| December 2022 | Complete Month | 50 | 74 | 148.00% |
| January 2023 | Complete Month | 147 | 62 | 42.18% |
| February 2023 | Complete Month | 114 | 94 | 82.46% |
| March 2023 | Complete Month | 164 | 134 | 81.71% |
| April 2023 | Complete Month | 154 | 120 | 77.92% |
| May 2023 | Complete Month | 241 | 162 | 67.22% |
| June 2023 | Complete Month | 272 | 200 | 73.53% |
| July 2023 | Complete Month | 237 | 180 | 75.95% |
| August 2023 | Complete Month | 214 | 165 | 77.10% |
| September 2023 | Complete Month | 227 | 137 | 60.35% |
| October 2023 | Complete Month | 240 | 131 | 54.58% |
| November 2023 | Complete Month | 142 | 122 | 85.92% |
| December 2023 | Complete Month | 56 | 72 | 128.57% |
| January 2024 | Complete Month | 125 | 82 | 65.60% |
| February 2024 | Complete Month | 143 | 115 | 80.42% |
| March 2024 | Complete Month | 152 | 123 | 80.92% |
| April 2024 | Complete Month | 271 | 186 | 68.63% |
| May 2024 | Complete Month | 308 | 218 | 70.78% |
| June 2024 | Complete Month | 269 | 196 | 72.86% |
| July 2024 | Complete Month | 241 | 182 | 75.52% |
| August 2024 | Complete Month | 194 | 162 | 83.51% |
| September 2024 | Complete Month | 239 | 171 | 71.55% |
| October 2024 | Complete Month | 195 | 168 | 86.15% |
| November 2024 | Complete Month | 143 | 126 | 88.11% |
| December 2024 | Complete Month | 52 | 70 | 134.62% |
| January 2025 | Complete Month | 118 | 78 | 66.10% |
| February 2025 | Complete Month | 130 | 95 | 73.08% |
| March 2025 | Complete Month | 172 | 113 | 65.70% |
| April 2025 | Complete Month | 259 | 183 | 70.66% |
| May 2025 | Complete Month | 281 | 206 | 73.31% |
| June 2025 | Complete Month | 279 | 215 | 77.06% |
| July 2025 | Complete Month | 271 | 201 | 74.17% |
| August 2025 | Complete Month | 216 | 168 | 77.78% |
| September 2025 | Complete Month | 315 | 215 | 68.25% |
| October 2025 | Complete Month | 228 | 187 | 82.02% |
| November 2025 | Complete Month | 158 | 136 | 86.08% |
| December 2025 | Complete Month | 66 | 78 | 118.18% |
| January 2026 | Complete Month | 93 | 79 | 84.95% |
| February 2026 | Complete Month | 131 | 91 | 69.47% |
| March 2026 | Complete Month | 138 | 101 | 73.19% |
| April 2026 | Complete Month | 173 | 111 | 64.16% |
| May 2026 | Complete Month | 328 | 188 | 57.32% |
| June 2026 | Complete Month | 355 | 244 | 68.73% |
| July 2026 | Complete Month | 277 | 220 | 79.42% |
| August 2026 | Complete Month | 241 | 155 | 64.32% |
Reconciliation and limitations
Reconstructed versus authoritative annual counts
The canonical historical reconstruction and the retained authoritative annual layer differ slightly for 2021–2024: the reconstructed House sold counts are lower by 2, 2, 4 and 4 records. They match in 2025. These small differences are disclosed rather than blended away. Annual public sold counts and medians use the authoritative layer; monthly history uses the conditional canonical reconstruction.
Why active inventory and months of inventory are absent
The extracts do not provide a complete governed transition ledger for every property at every month-end. A latest-state snapshot cannot reliably recreate whether each listing was active on an earlier date. Without that state history, month-end inventory and months of inventory would look precise while resting on assumptions the source cannot verify.
Why expired, cancelled, withdrawn and suspended are not grouped as “failed to sell”
An off-market record may later relist under another MLS number, return after a suspension, change brokerages, sell privately or leave the market for a reason the export does not capture. The master preserves relist and status evidence for audit, but address ambiguity and incomplete transitions prevent a defensible terminal-outcome rate. These statuses are therefore not collapsed into a public failure statistic.
Why historical DOM and CDOM are absent
DOM/CDOM fields appear in the sources, but field meaning, relist resets and cross-system consistency are not governed across the whole period. Publishing a long trend would suggest comparability that has not been proved.
Why the price history starts in 2021
Older recovered partitions contain some close-price values, but not complete citywide price coverage. Partial medians could shift with geography or source composition. The annual price chart therefore begins with the authoritative House fact layer in 2021.
What the page does not establish
It is not CREA HPI, a benchmark-price index, a same-home appreciation study, an appraisal or a forecast. It does not prove causation, measure an individual agent's performance or determine what one property should sell for.
Glossary
Canonical listing event: One reconciled MLS listing identity in the master dataset. A different MLS number remains a different listing event even when an address appears similar.
New-listing event: A distinct House listing event grouped by normalized listing-contract date.
Sold-close event: A distinct House listing event grouped by normalized close date. Price measures also require a supported positive close price.
Median close price: The middle supported closing price after values are ordered. It is not the average and does not measure same-home appreciation.
25th and 75th percentiles: The lower and upper boundaries of the middle half of supported closing prices.
Flow sales-to-new-listings ratio (SNLR): Sold-close events divided by new-listing events in the same period. It is not absorption, inventory, a same-listing conversion rate or a prediction.
Recorded list price: The ListPrice field retained in the export. It is not proven original or final list price for every record.
Sale-to-recorded-list ratio: Close price divided by recorded list price for supported paired records. It does not reconstruct price changes or offer competition.
Conditional reconstruction: An aggregate derived from recovered historical versions that are not byte-identical to the earlier registered files, with the difference and reconciliation disclosed.
Authoritative annual layer: The retained registered House fact layer used for annual sold counts and median prices from 2021.
Complete data tables
Six complete, identity-free aggregate data sections support this reference and are available on this page:
- Monthly House activity, September 2015–August 2026
- Annual House activity and price, 2015–2026 partial
- Rolling 12-month House activity
- House activity seasonality, 2016–2025
- Complete-month activity highs and lows
- House price and recorded-list support, March–July 2026
Bring the history back to today's decision
The historical record is most useful when it helps you ask a more specific question.
If you are selling, compare the broad market phase with your actual competition, recent relevant sales, condition, presentation and timing. Start with the Seller Experience, a Greater Sudbury home valuation, or the explanation of strategic pricing. The Seller Success Stories show how property-level decisions differ even within the same citywide market.
If you are buying, use the history to understand pace and seasonality without waiting for one perfect citywide signal. Search current homes through MLS Smart Search, compare communities in the Greater Sudbury communities brief, and use the home-shopping process to connect market context with property-level due diligence.
For current commentary, return to the Greater Sudbury market-update archive. If the question is about one property or one move, tell me what you are working through.
Expect Moore for Your Real Estate.
— Chad Moore, REALTOR® | Lake City Realty